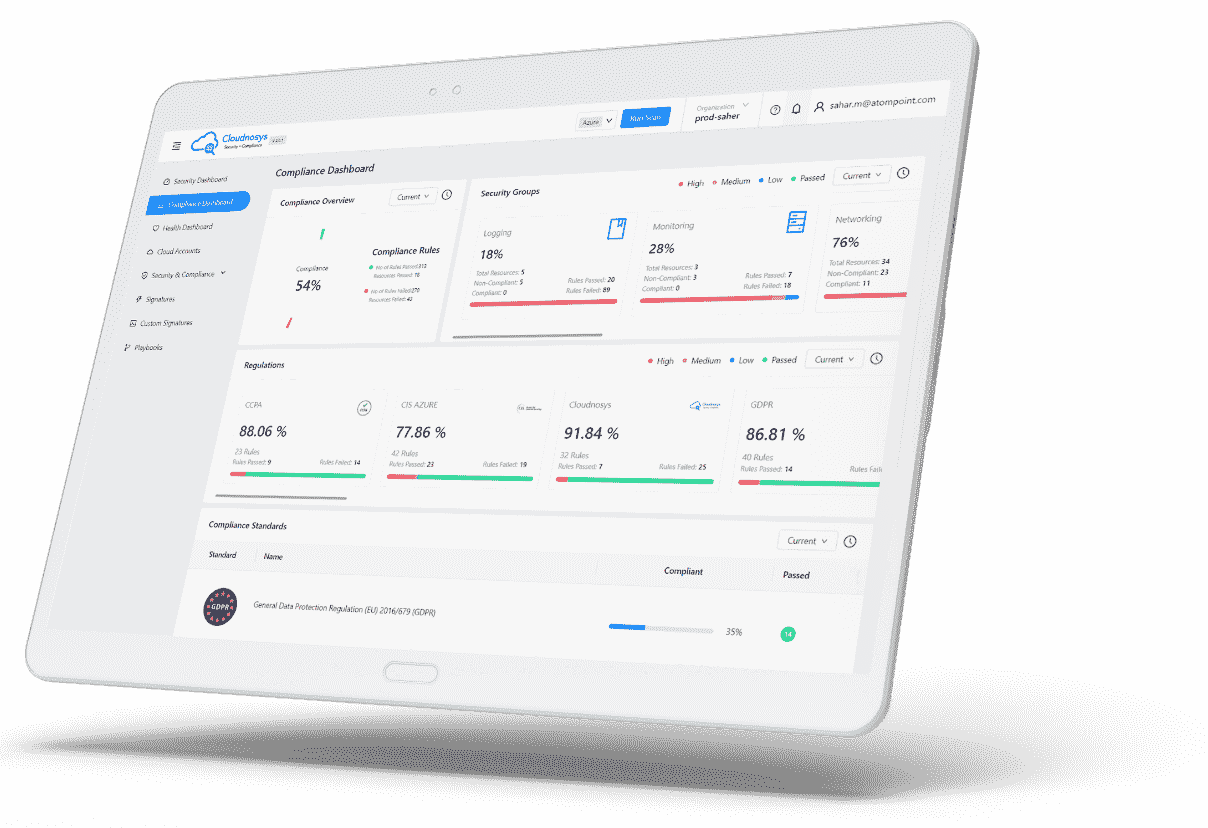
Summary Widgets #
To deliver concise and pertinent insights, our top-notch dashboards feature two key widgets positioned at the dashboard’s forefront. These widgets offer comprehensive summaries of your resource data and associated risks, ensuring you have a quick and insightful overview of your resources and potential vulnerabilities.
Instant Resource Insights: Inventory Summary widget #
Offers a holistic view of your cloud resources, providing valuable information at a glance. With this widget, you can effortlessly assess the overall status of your resources and make informed decisions to strengthen your cloud security.
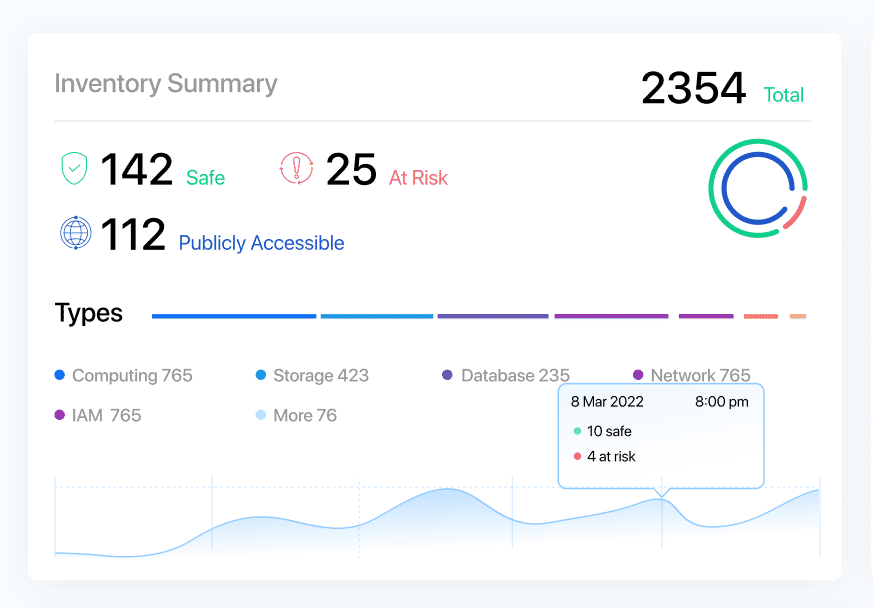
Key features of the Inventory Summary widget include:
- Total Number of Resources: Get an overview of the total count of resources in your cloud environment.
- Number of Safe Resources: Identify the number of resources categorized as safe, ensuring a secure foundation for your cloud infrastructure.
- Number of Resources at Risk: Quickly identify the number of resources that are currently at risk, enabling proactive risk mitigation.
- Number of Publicly Accessible Resources: Understand the scope of publicly accessible resources, ensuring proper security measures are in place.
- Donut Chart: Visualize the proportion of Safe Resources and Resources at Risk, providing a clear understanding of the overall risk landscape.
- Number of Resources by Service Type: Gain insights into the distribution of resources across different service types.
- Resource Service Type Count Bar: Visualize resource distribution by service type, enabling efficient prioritization and optimization.
- Trend Graph: Track the number of resources over the last 7 days, helping you monitor resource growth and identify any anomalies.
With the Inventory Summary widget, you have a comprehensive overview of your cloud resources, allowing you to prioritize actions, mitigate risks, and maintain a robust cloud security posture. Explore the widget and unlock a new level of visibility and control over your cloud environment.
Quick Risk Insights: Risk Summary widget #
Empowers you with a comprehensive overview of the risks associated with your cloud resources. With this widget, you can quickly assess the risk landscape, prioritize actions, and fortify your cloud security with confidence.
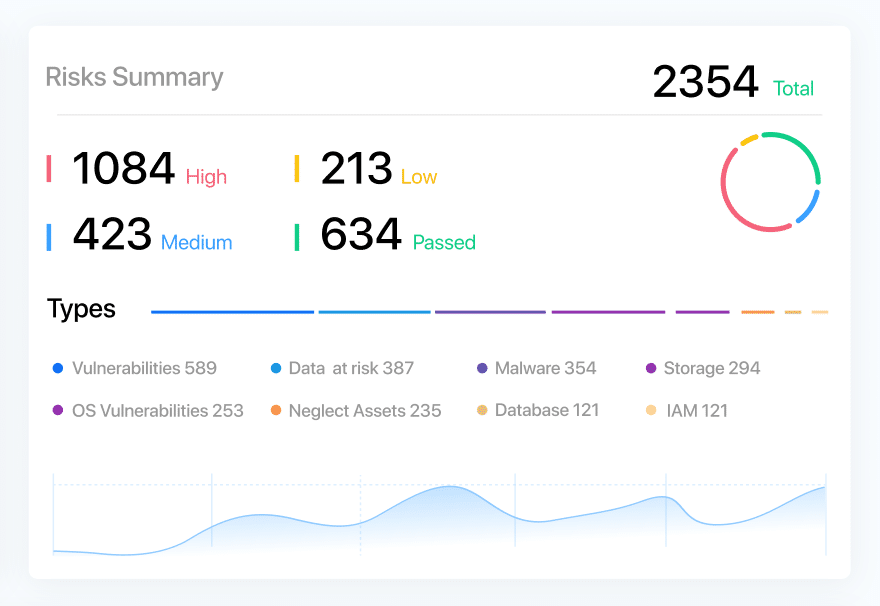
Key features of the Risks Summary widget include:
- Total Number of Risks in All Resources: Get a consolidated count of all risks across your cloud environment, enabling you to gauge the overall risk exposure.
- Number of Risks by SeverityType: Understand the distribution of risks by severity levels, allowing you to focus on critical areas that require immediate attention.
- Donut Chart: Visualize the proportion of risks divided by varying levels of severity, providing a clear understanding of the risk distribution and helping you prioritize mitigation efforts effectively.
- Number of Risks by Risk Type: Gain insights into the distribution of risks across different risk types, enabling you to address vulnerabilities specific to your environment.
- Risk Type Count Bar: Easily identify the proportion of each risk type through a visual bar, assisting you in identifying areas of concern and prioritizing risk mitigation strategies.
- Trend Graph: Track the number of risks over the last 7 days, empowering you to monitor the risk trend and identify any emerging patterns or potential vulnerabilities.
The Risks Summary widget offers a concise yet comprehensive snapshot of the risks in your cloud resources, allowing you to make informed decisions, prioritize actions, and strengthen your overall cloud security posture. Explore this widget and take control of your risk management today.
Quick Glance at the Top 4: Critical Risks widget #
Brings you actionable insights by showcasing prioritized risks for each selected risk type. Experience a new level of risk awareness as you delve into the most critical vulnerabilities specific to your environment.
Risks by Region #
Portray heat maps on regions that have risks, categorized with different severities.
Do you want to know which regions are most affected by risks? Just place the cursor on your desired region, it will show you the region name & total.

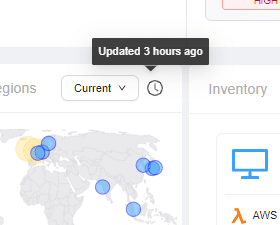
Latest Updated time #
The widgets are updated when the scan gets completed & the Clock icon shows the last updated time of the widgets. This clock icon can be found on this widget as well as all the widgets below.
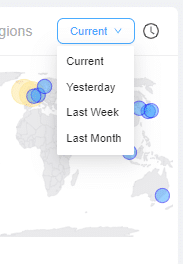
Historical Snapshot #
The History Snapshot dropdown, located in the top right corner of each widget (except the first 3), empowers users to explore historical data and track changes over time. With a range of options including “Current,” “Yesterday,” “Last Week,” and “Last Month,” users can customize their view to suit their analysis needs.
Inventory widget #
Provides users with a concise snapshot of their cloud infrastructure inventory, categorized into five essential resource types: Computing, Storage, Databases, Identity and Access Management (IAM), and Network. This widget is designed in a horizontal layout, comprising five distinct containers, each representing one of these resource types.

With this widget, you gain immediate visibility into your cloud inventory across these critical resource types, facilitating efficient management and resource allocation decisions.
Most Critical Resources widget #
The “Top Risk Resources” widget provides a comprehensive view of the resources within your cloud environment that demand the most attention. If you have numerous resources in your cloud account, this widget identifies and displays the top 10 resources with the highest risk levels in descending order. It serves as a valuable tool for prioritizing and addressing potential security and compliance issues.
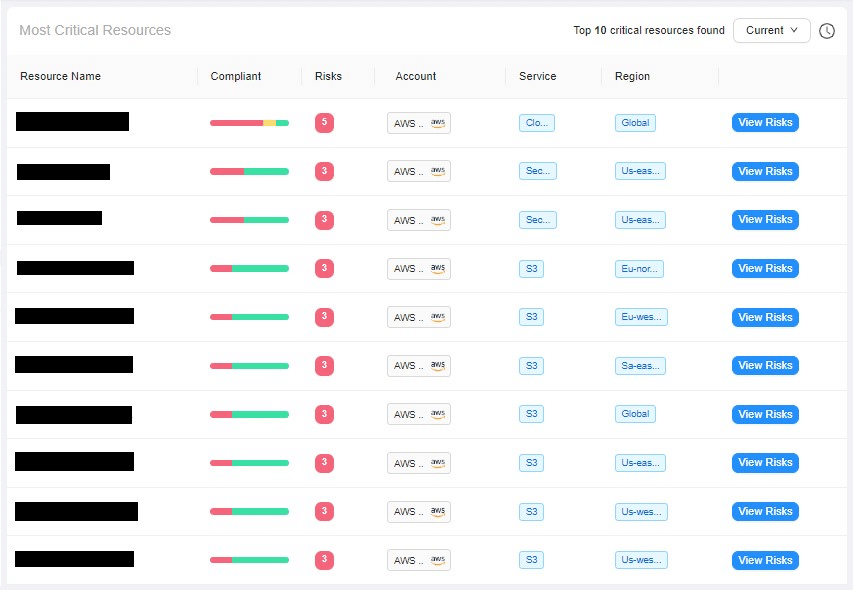
This widget takes the form of a structured table, offering the following columns:
- Resource Name: Lists the names of the identified resources.
- Compliant: Displays the proportion of risk levels for each resource.
- Risks: Displays the number of risks on each resource.
- Account Name: Specifies the name of the cloud account to which each resource belongs.
- Service: Identifies the cloud service or platform associated with each resource.
- Region: Notes the geographical region where each resource is located.
Additionally, each row in the table includes a column featuring a “View Risks” button. Clicking this button opens the Resource Profile drawer, allowing users to access detailed information and insights regarding the specific resource’s risks and associated actions.
Risks by Group widget #
Provides a visual representation of risk distribution across your Security Groups, offering valuable insights into potential vulnerabilities within each category.
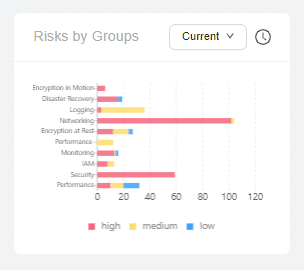
This horizontal bar chart presents the number of risks associated with each Security Group, categorized by severity levels. The Security Groups are:
- Disaster Recovery
- Encryption in Motion
- Encryption at Rest
- Encryption in Transit
- Logging
- Monitoring
- Security
- Identity and Access Management (IAM)
- Networking
- Performance